MLOps for Data Scientist
building cool stuff @ longshot.ai
As machine learning and AI propagate in software products and services, best practices and tools are needed to test, deploy, manage and monitor ML models in real-world production. In short MLOps is CI-CD + Retraining the ML models in laymen terms.This is what MLOps is all about. We use Kubeflow, Datarobot, MLflow etc for
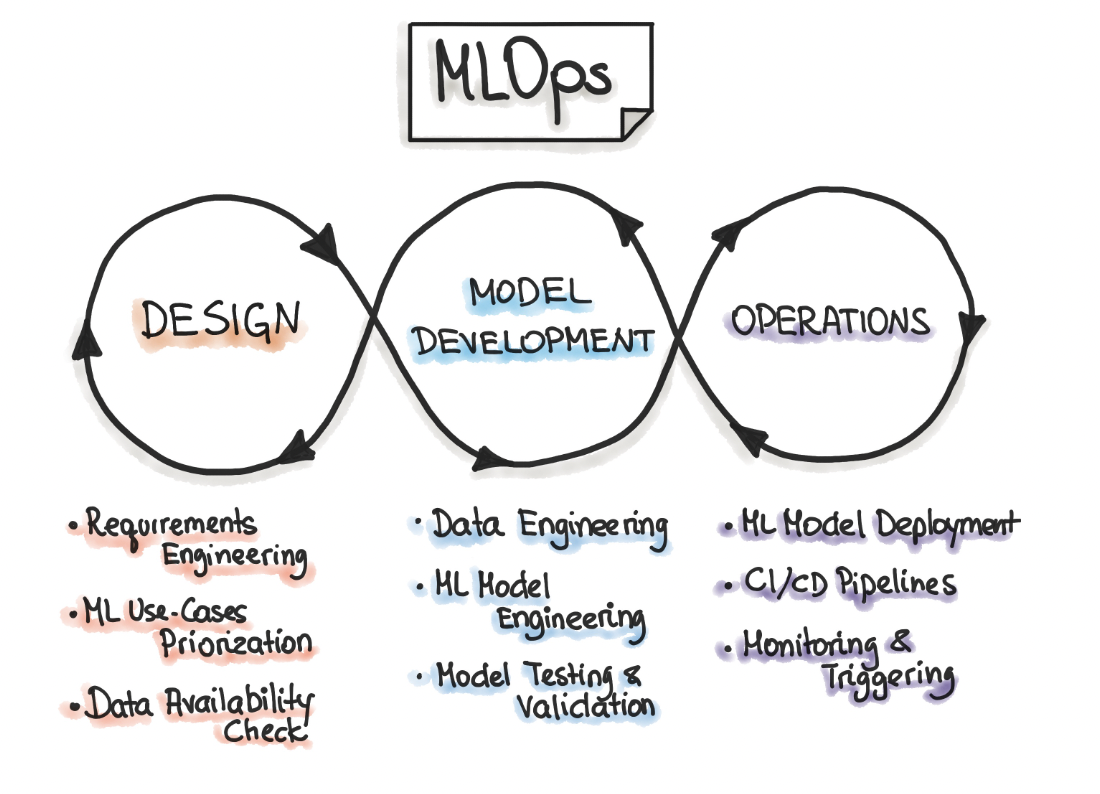
Advantages of MLOps for Data Scientists
With numerous processes and teams involved in getting models into production, many data scientists find that their models get stuck at the finish line. In order to solve these problems MLOps come handy.
Deployment
MLOps offers deployment that is totally agnostic. You pick platform you want to deploy on. You pick which frameworks or language to be used.
Monitoring
Monitoring models is essential to ensuring that they are continually producing value. MLOps gives you a system for monitoring all your models, mo matter where they are deployed or what frameworks you used to build the models.
Production Lifecycle Management:
Your models will need to be updated. Manual updates are time-consuming and problematic. Lifecycle management makes it easier for data scientists to manage a large portfolio of production models.
Production Model Governance
Deployment is just the start. It's also important to have in place robust governance practices, reviews, processes, and tools to minimise risk and ensure regulatory compliance.
Similarities between data science and MLOps
Data science is a broad subject while MLOps is a specialisation subject but they share a lot between them in terms of deployment and functioning. Here is a look at some of the similarities.
Both data science and MLOps require an understanding of the business at the highest level. This includes understanding the problem and coming up with a solution.
People in the field of data science and MLOps are required to be proficient in Python and SQL.
Both the fields require their practitioners to be well versed in the concept of training and testing
A data scientist and an MLOps engineer are expected to work with Git and Github
The fundamental requirement in data science and MLOps is for a person to know everything about their company data, and be prepared to find more data by knowing where to look for it
Typical ML Project Lifecycle
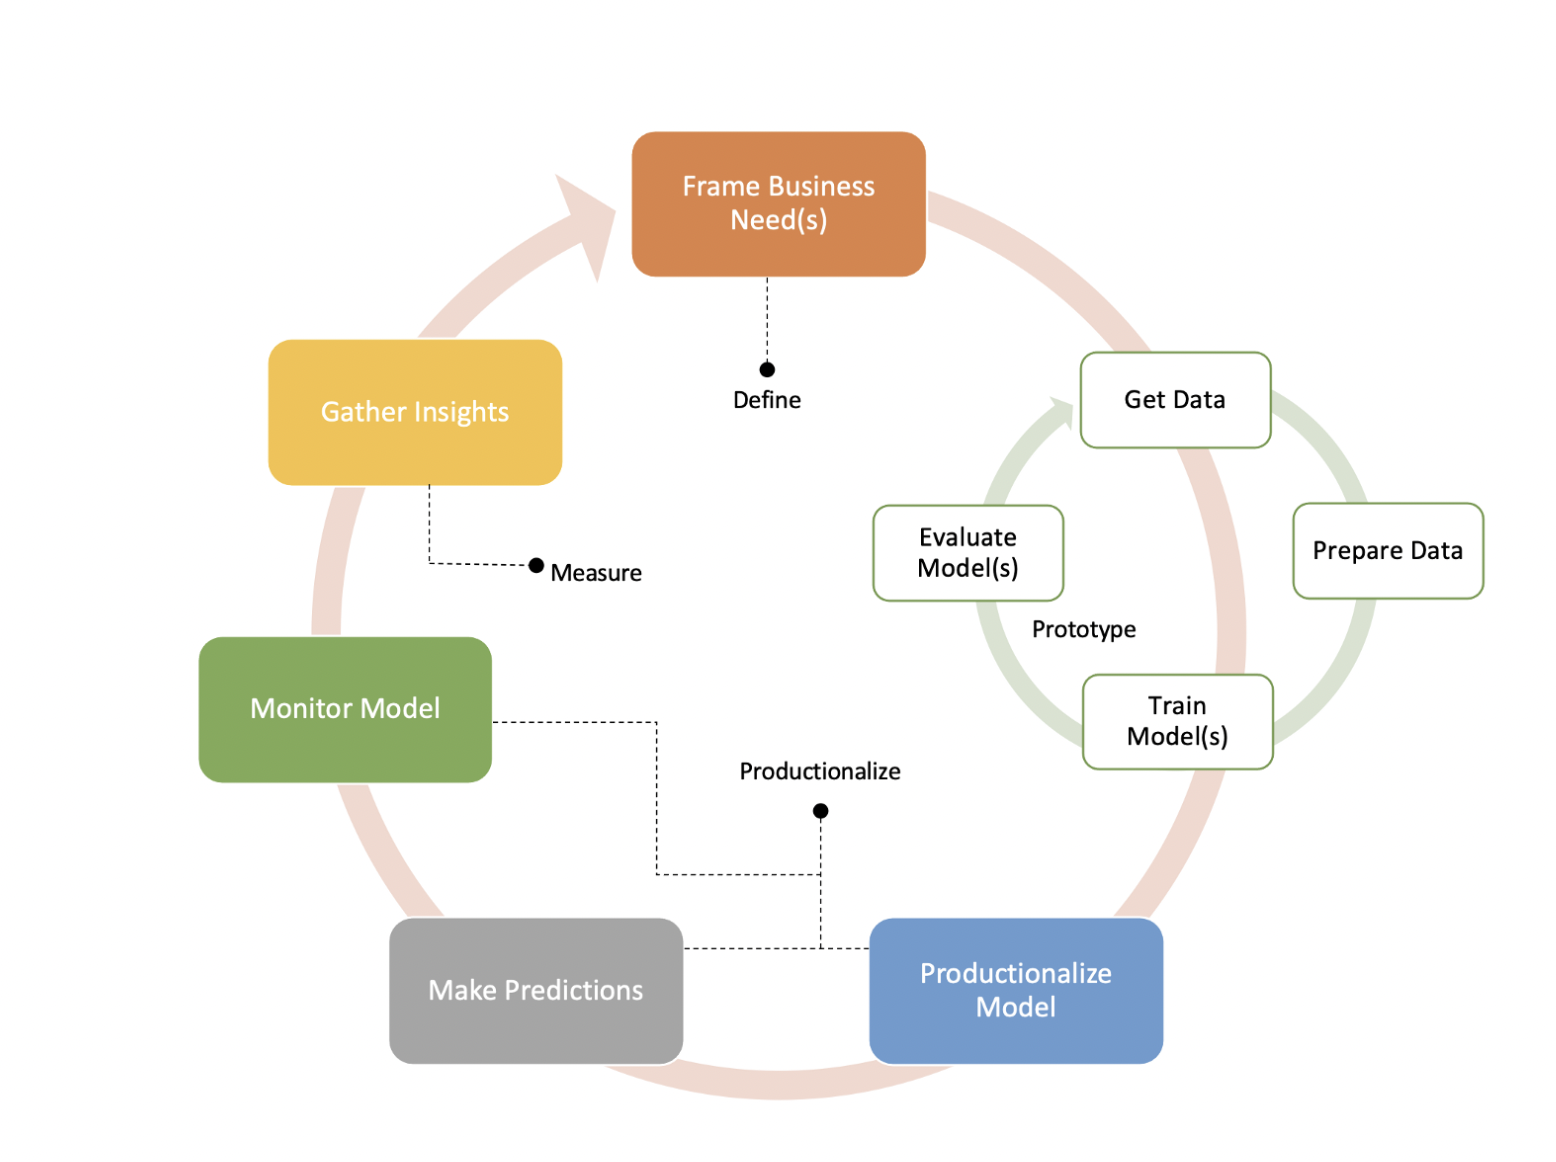
In the first phase, and before we get elbow-deep in our data, it is important to set ourselves up for success. Therefore, alongside the business experts, we need to carefully define our problem and the business objectives! We need to answer some important questions that allow us to take training and serving decisions regarding the design of the model and the production pipeline. For example:
What is the ideal outcome?
What is our evaluation metric? How can we define an ROI?
What are the success and failure criteria?
What are the latency requirements? And can we get each feature for serving within the latency requirements? …
In the second phase, we prototype our first ML model, or in other words, we perform an ML feasibility study.
Therefore, we prove the ML business value using the metric defined in the first phase. Remember, the best practice for ML engineering rule number 1 is keep the first model simple and get the infrastructure right. The first model provides the biggest boost to our product, so it doesn’t need to be the fanciest model at the beginning.
In the third phase, we move to production. This is the main topic of this article so we will see this more in detail in the coming sections. Once our production pipeline is ready and well designed, we can gather insights and iterate new ideas much faster and more efficiently.
Data Ingestion:
This component is usually external and outside the ML pipeline of our use case. In mature data processes, data engineers should be optimizing continuous data ingestions and transformations to continuously deliver up-to-date data to the different data analytics entities within the organization who are looking forward to uncovering data-driven insights and better-informed decisions.
Data validation:
In this component, our focus is on validating the input data fed to our pipeline. One cannot underestimate this problem’s significance in ML systems. Regardless of the ML algorithms employed, errors in data can severely impact the quality of the generated model. As one popular data science concept says “garbage in, garbage out”. Therefore, it is crucial to spot data errors early.
Another role error-free data can play is in terms of model output analysis. This component allows us to properly understand and debug the output of our ML model. As a result, data must be considered a first-class citizen in ML systems, just like algorithms and infrastructure. It must be continuously monitored and validated at every execution of the ML pipeline.
Data Transform
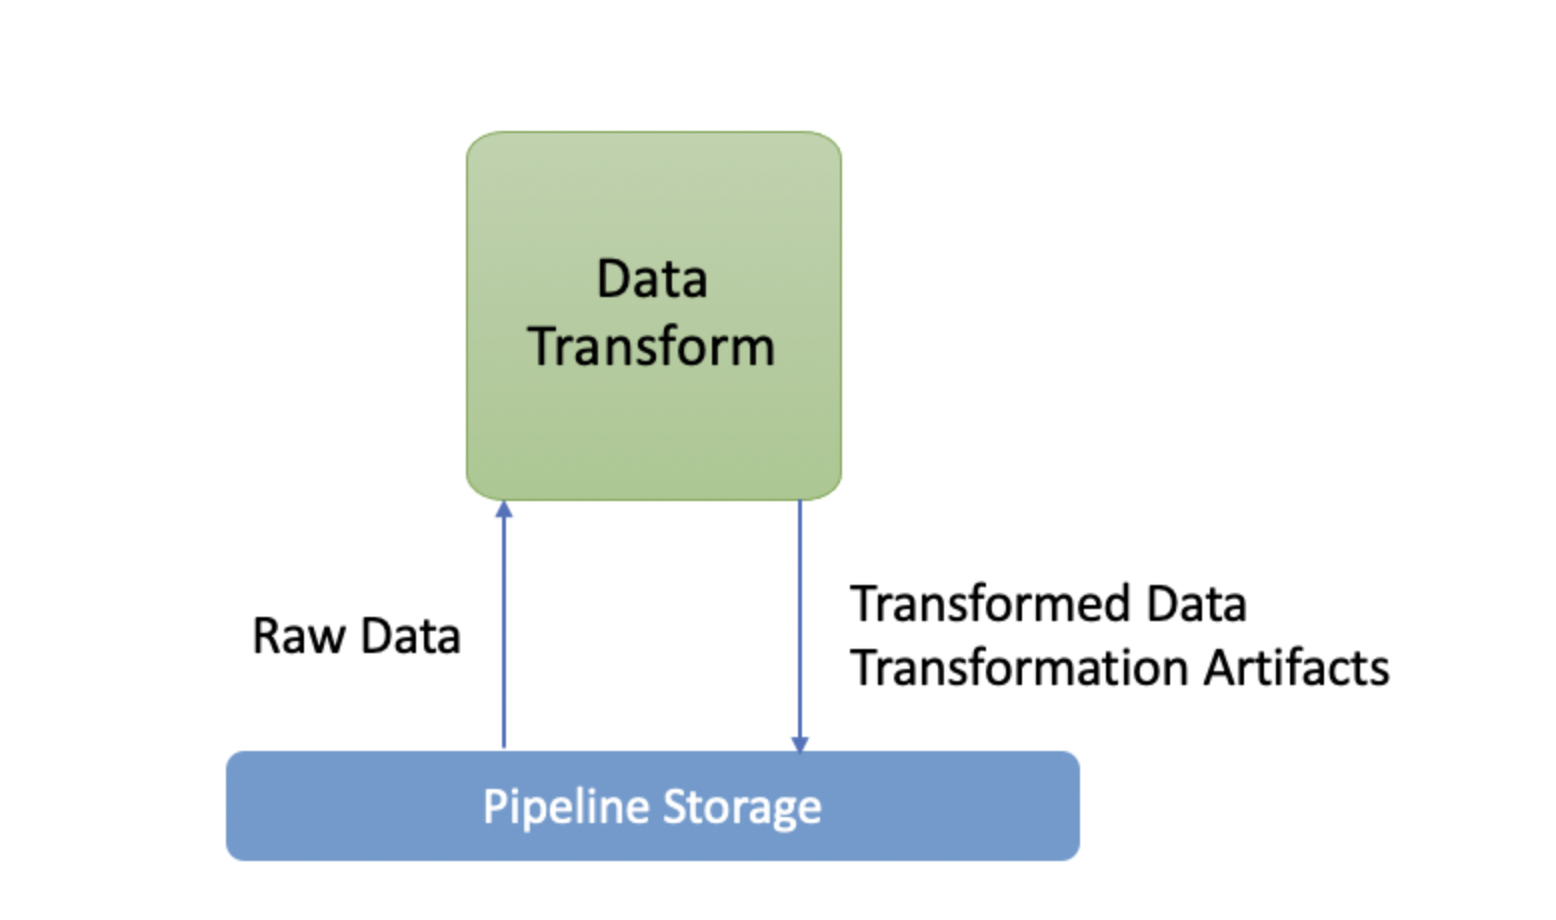
In this step, the data is prepared for the ML task. This involves data cleaning, filtering, data transformations, and feature wrangling. It should do things like generate features to integer mappings. Besides, this component prepares features metadata that might be needed in the trainer component (This includes for example the meta parameters needed in the training step for features normalization, the dictionaries needed for categorical variables encoding, etc…). These are called transformation artifacts; they help with constructing the model inputs.
Critically, whatever mappings that are generated must be saved and reused at serving time (when the trained model is used to make predictions). Failure to do this consistently results in the Training Serving Skew problem we talked about earlier.
Model Training
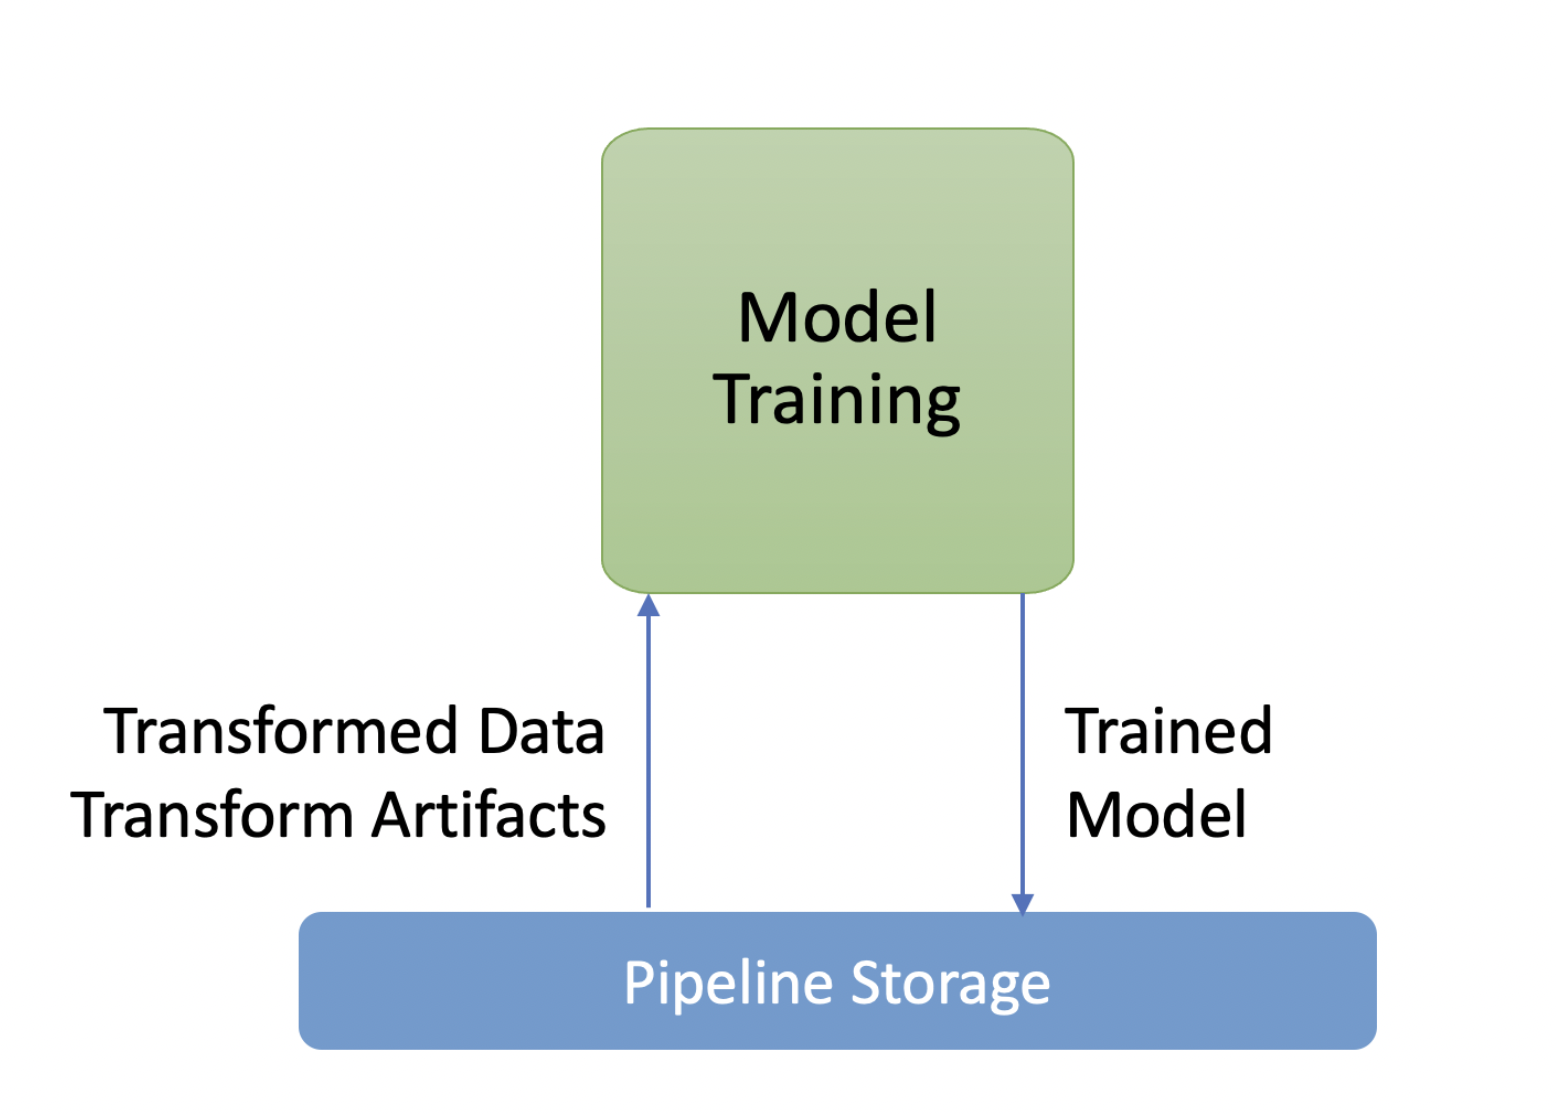
The model training component is responsible for training our model. In most use cases, models can train for hours, days, and even weeks. Optimizing a model that takes multiple weeks of training, is not workable. In other cases, the data used to train the model doesn’t even fit in memory.
In that scenario, the model training component should be able to support data and model parallelism; and scale to large numbers of workers. It should also be capable of handling out-of-memory data.
Ideally, all the components of our ML system should be scalable and running on infrastructure that supports scalability.
This model training component should also be able to automatically monitor and log everything while training. We cannot train a machine learning model over a large period of time without seeing how it’s doing and making sure it’s correctly configured to minimize the loss function with the number of iterations. Finally, the training component should also support hyperparameter tuning.
Model Analysis
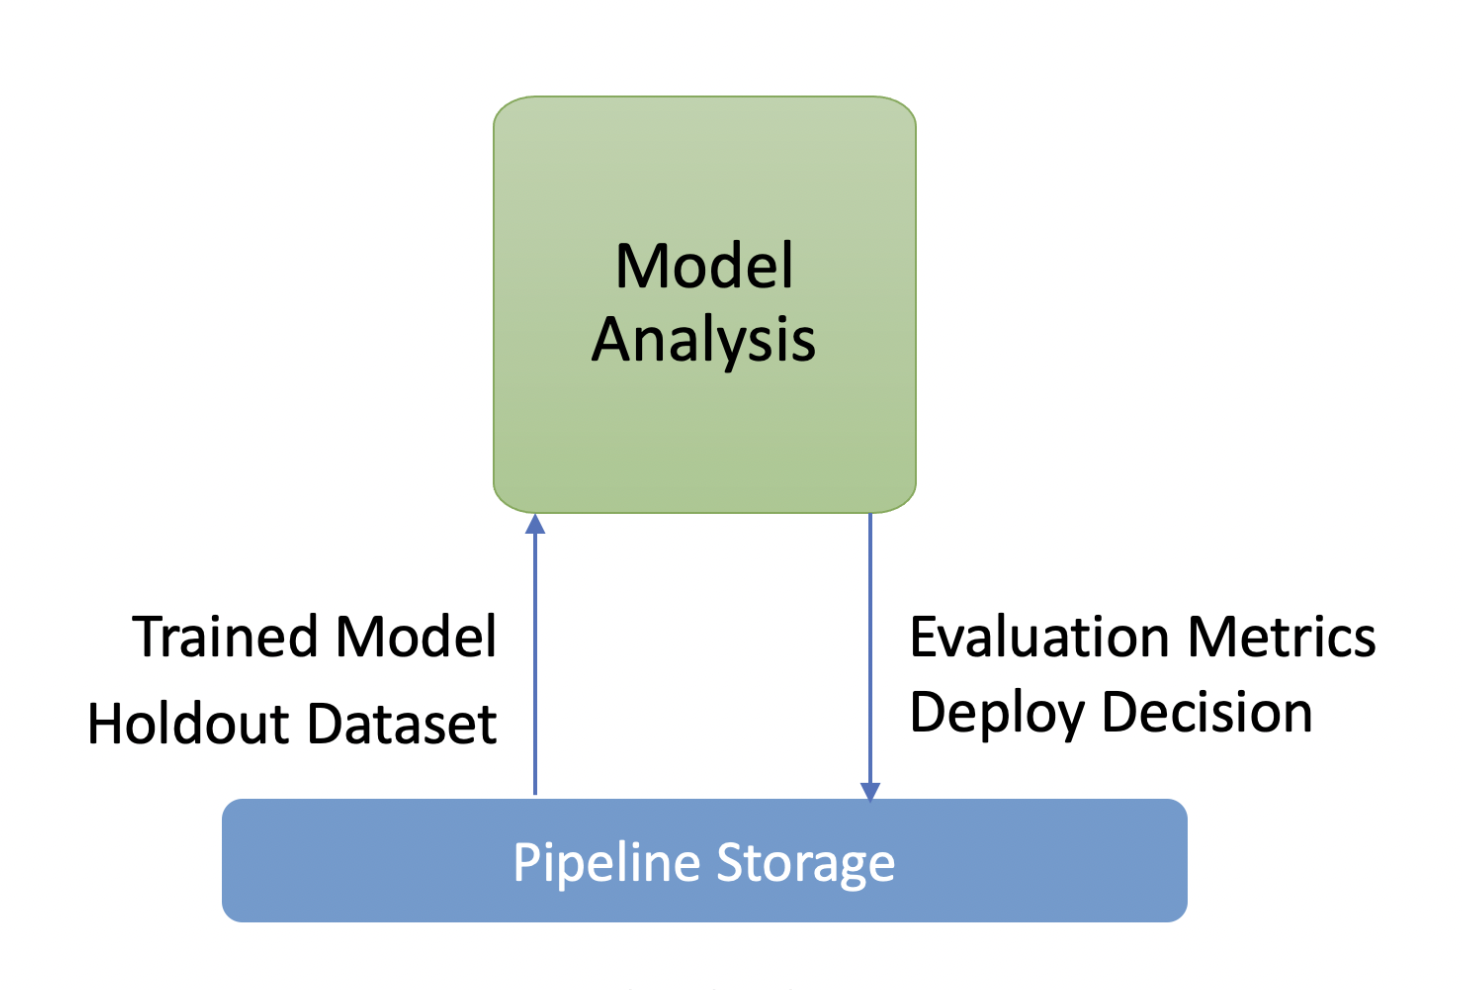
In the model analysis component, we conduct a deep analysis of the training results and ensure that our exported models are performant enough to be pushed to production. This step helps us guarantee that the model is promoted for serving only if it satisfies the quality criteria we preset during the framing phase. The criteria must include improved performance compared to previously deployed models and fair performance on the various data subsets/slices.
Model Serving
In contrast to the training component where we usually care about scaling with data and model complexity. At the serving component, we are interested in responding to variable user demand by minimizing response latency and maximizing throughput.
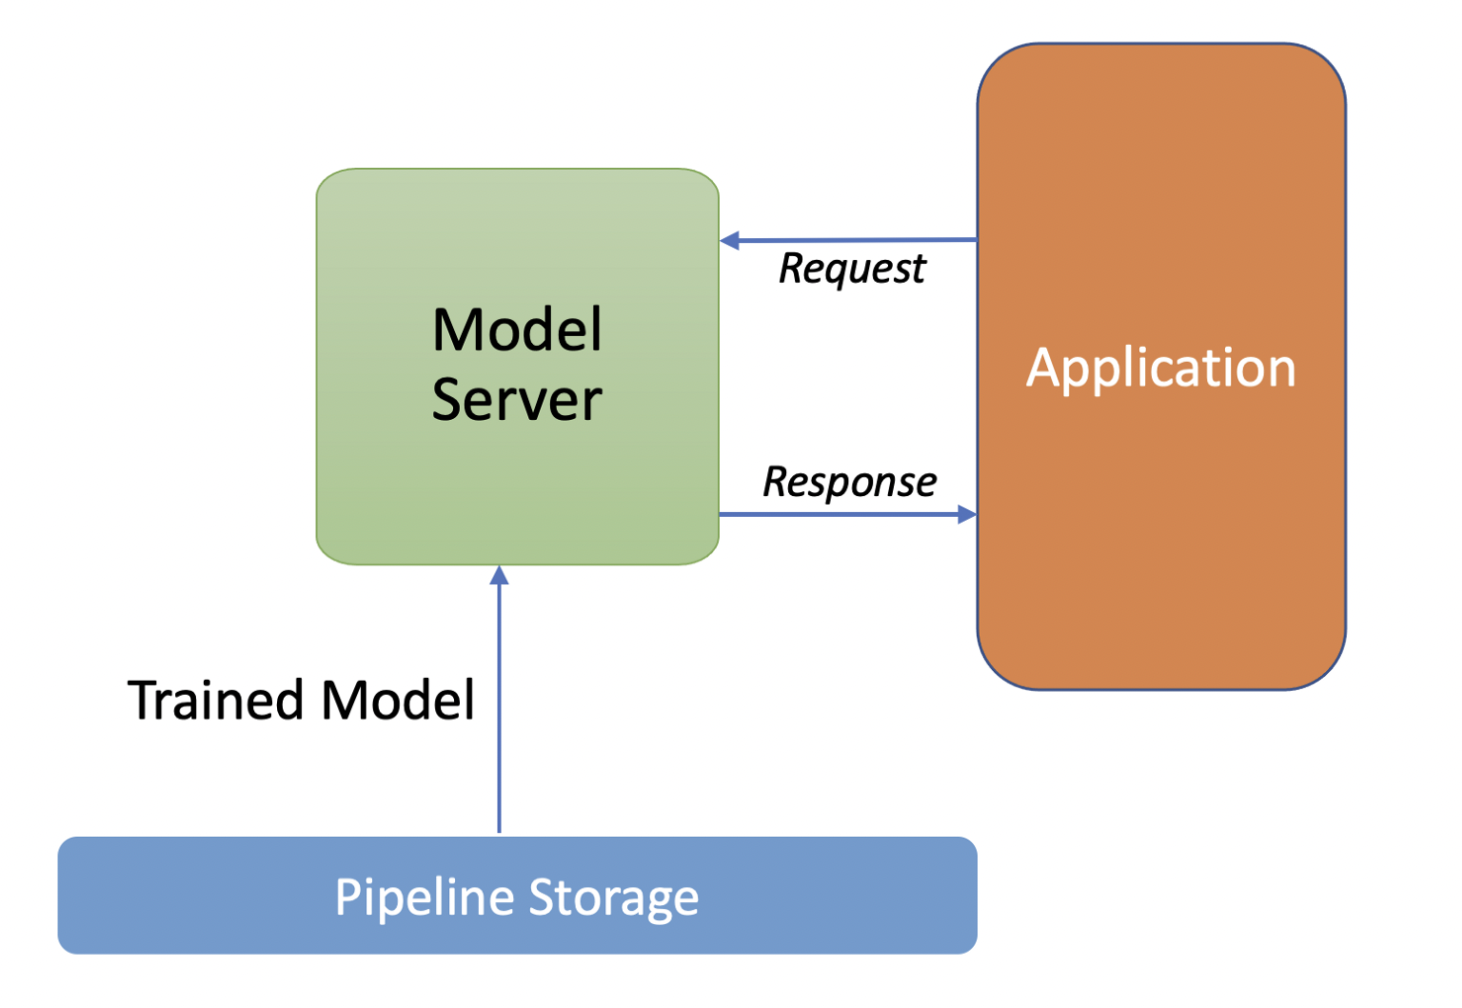
Therefore, the serving component should have low latency to respond quickly to users, highly efficient so that many instances can be run simultaneously if needed, scale horizontally, reliable and robust to failures.
We also need our serving component to easily be able to update to new versions of the model. When we get new data or trigger a new pipeline run, or test new model architecture ideas, we’ll want to push a new version of the model and we want the system to seamlessly transition to this new version.
Pipeline Orchestration Component
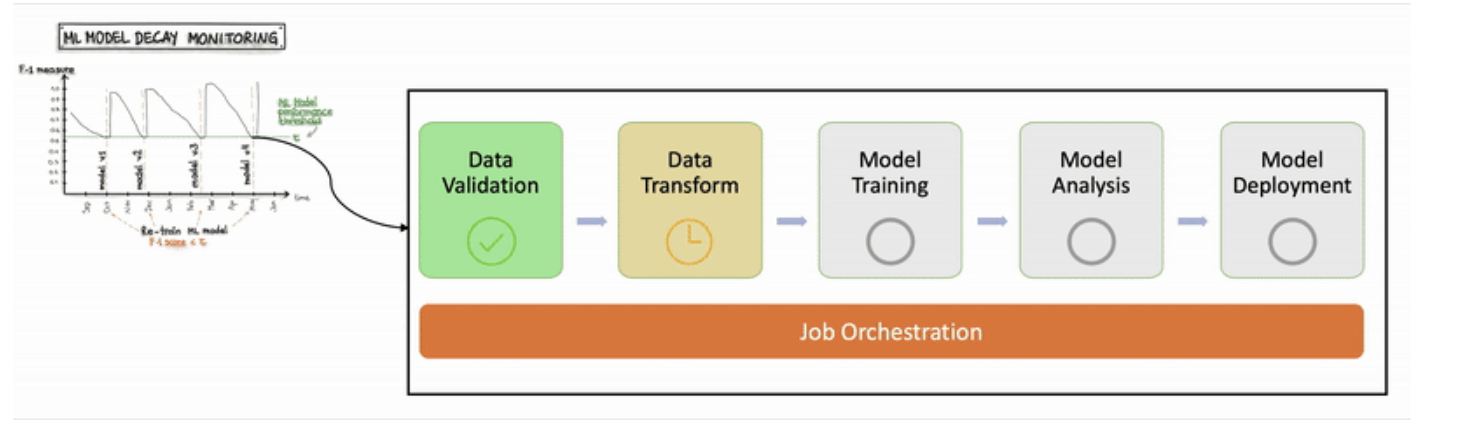
The automation level of the steps we just described defines the maturity of our ML system, it also reflects the velocity of training new models triggered by model decay or given new data.
A manual process happens to be very common in many use cases currently. It might be sufficient when models are rarely changed due to static data distribution. But in practice, this is rarely the case. Data is often dynamic and models frequently break when they are deployed in the real world. Static models will surely fail to adapt to changes in the data that describes the environment.
A manual process can also be dangerous as it creates a disconnection between ML training and ML serving. It separates the data scientists who create the model and the engineers who operate the model as a prediction service. And this process can lead to the training serving skew problem.
The goal of the orchestration component is to connect the different components of the system. It runs the pipeline in a sequence and automatically moves from one step to another based on the defined conditions. This is the first step to automation as we can now automatically train new models in production using fresh data based on live pipeline triggers. We need to pay attention to that in production, we’re not deploying a trained model as a prediction service. We’re actually deploying a whole training pipeline, which automatically and recurrently runs to serve the trained model as the prediction service.
Pipeline Metadata storage
The role of the pipeline metadata storage is to record all details about our ML pipeline executions. This is very important in order to keep the lineage between components and reproduce deployed models anytime needed. It also helps us debug any encountered errors.
Each time we execute the pipeline, the store records all the details about our pipeline execution such as:
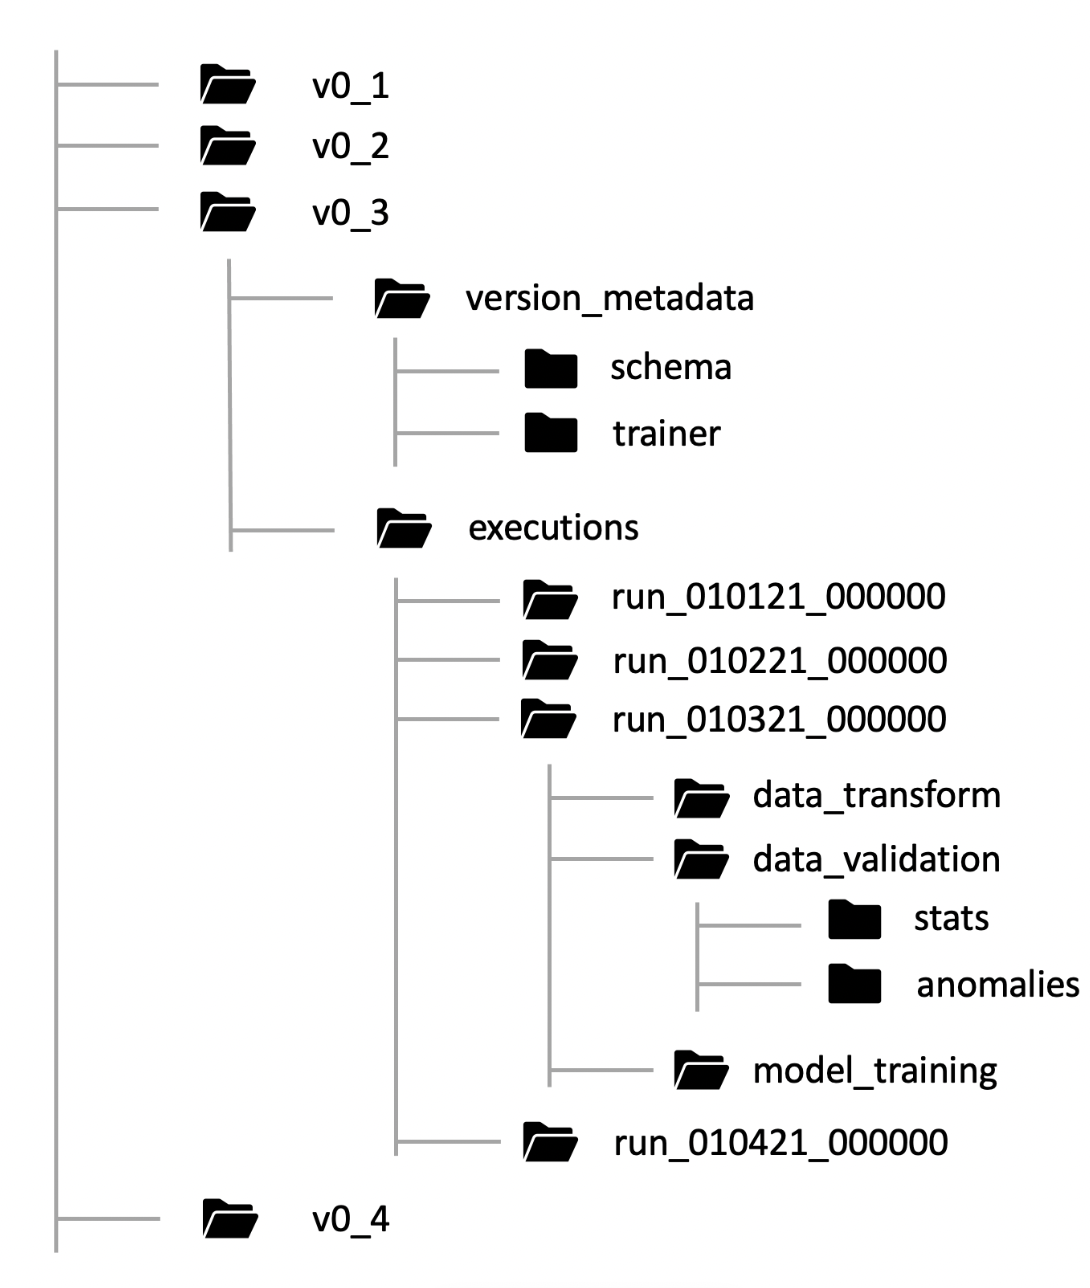
The versions of our pipeline and components source codes that were executed.
The input arguments that were passed to our pipeline.
The artifacts/outputs produced by each executed component of our pipeline, such as the path to the raw data, transformed datasets, validation statistics and anomalies, trained model…
The model evaluation metrics, and the model validation decision regarding model deployment, which is produced during the model analysis and validation component…
CI/CD Pipeline Automation
So far we were only talking about how can we automate the continuous execution of the ML pipeline to retrain new models based on triggers such as the availability of new data or model decay to capture new emerging patterns.
But what if we wanted to test a new feature, a new model architecture, or a new hyperparameter? That’s what an automated CI/CD pipeline is about. A CI/CD pipeline allows us to rapidly explore new ideas and experimentations. It lets us automatically build, test, and deploy the new pipeline and its components to the intended environment.
Here’s how the CI/CD pipeline automation complements the continuous ML pipeline automation:
If given new implementation/code (new model architecture, feature engineering, and hyperparameters …), a successful CI/CD pipeline deploys a new continuous ML pipeline.
If given new data (or a model decay trigger), a successful automated continuous pipeline deploys a new prediction service. To train a new ML model with new data, the previously deployed ML pipeline is executed on the fresh data.
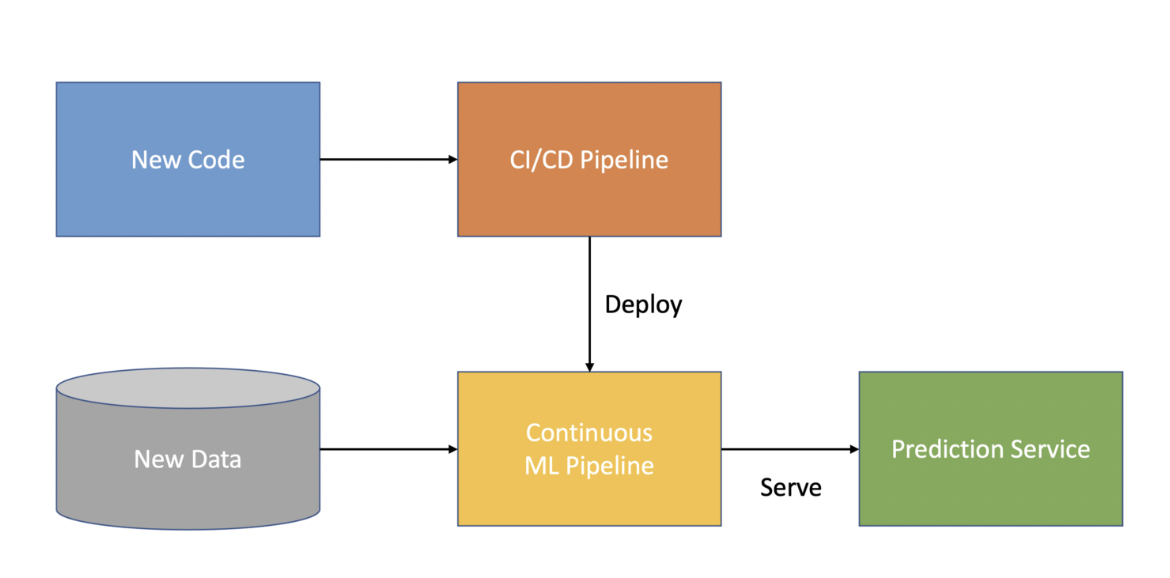
A complete end-to-end automated pipeline should look like this:
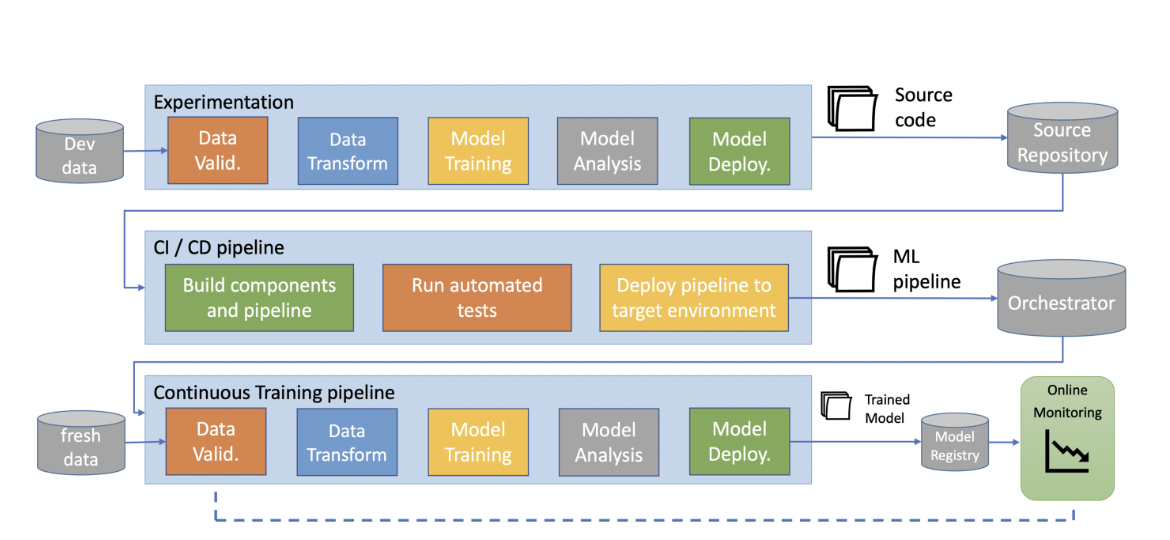
We iteratively try out new ML ideas where some of our pipeline components are updated (introducing a new feature for example will see us update the data transform component…). The output of this stage is the source code of the new ML pipeline components that are then pushed to a source repository of the targeted environment.
The presence of a new source code will trigger the CI/CD pipeline which will in return build the new components and pipeline, run the corresponding unit and integration tests to make sure everything is correctly coded and configured, and finally deploy the new pipeline to target environment if all tests have passed. The unit and integration tests for ML systems deserve an independent article themselves.
The new deployed pipeline is automatically executed in production based on a schedule, or presence of new training data, or in response to a trigger. The output of this stage is a trained model that is pushed to the model registry and continuously monitored.
Flyte for Data Scientists
I was a one-stop-shop in many of my previous positions, so I know how problematic bad data can be. I have seen how it affects the entire business — reports show different results, strategy changes, and customers start to doubt the data and product. Experiencing these changes highlights the importance of clean data.
How do we go from the raw data to clean data? We create data pipelines. Lots of them. Then, we schedule them. This requires a ton of orchestration, and finding the right tool to do so is vital.
I recently talked a bit about Prefect and my efforts in learning this phenomenal tool.
Though Prefect is definitely changing the game in comparison to orchestration tools like Airflow and Azure Data Factory, it still has some downfalls; one is that it does not easily integrate with machine learning and spark tools.
Today, I will introduce a data orchestrator tool called Flyte that can all of that plus some.
What is Flyte?
Let’s introduce Flyte. Have you ever heard of a company called Lyft? Well, of course, you have! Flyte was actually created at Lyft in collaboration with Spotify, Freenome, and many others.
It can service Python, Java, and Scala. And it was created on top of Kubernetes, so it includes all those perks, including reproducibility, portability, scalability, and reliability. Everything is on your infrastructure, so you can see everything that Flyte is doing. With that same mindset, Flyte versions and audits all the actions that are performed.
I have always loved open source libraries. Sure, it might take some time to get started, but the end result is getting a whole community coming together to create a great product. Flyte is no exception as it is entirely open source with an Apache 2.0 license under the Linux Foundation with a cross-industry overseeing committee.
Key concepts
The smallest unit is a task. They are fully independent units of execution and first-class entities of Flyte and, therefore, the fundamental building blocks of a user’s code. Each task also has two characteristics: they are fault-tolerant and have a caching/memoization mechanism.
A combination of tasks makes up what is called a workflow. These workflows are defined in protobuf, which is smaller and faster than the typical JSON format. Users can define workflows as a collection of nodes, and these nodes within a workflow can produce outputs that subsequent nodes could consume as inputs. These nodes and their dependencies dictate the structure of the workflow. Thus, a node will be one of three types depending on its purpose. A task node is an instance of a task, a workflow node contains an entire sub-workflow, and lastly, a branch node will change the output of the flow.
Each launch plan is associated with a specific workflow that has a unique set of input parameters. This allows for dynamic and static flows. Once a launch plan is created, we can easily share and execute them.
One hiccup with scheduling these launch plans is that they cannot be edited once a schedule is determined for a launch plan. A new version of the launch plan is created every time the schedule is changed.
Time for some examples!
Installing the Local Flyte Sandbox
Before we can install Flyte’s demo project, flytesnacks, we need to install the prerequisites:
Docker — Pick your correct version of Docker and follow their instructions here.
git — Pick your correct version of Docker and follow their instructions here.
flytectl
brew install flyteorg/homebrew-tap/flytectl
or
curl -sL https://ctl.flyte.org/install | bash
And then check whether flytectl was installed correctly:
flytectl version
Set up project
First, we have to download flytesnacks and flytekit, which we can do with this code:
git clone https://github.com/flyteorg/flytesnacks
cd flytesnacks/cookbook
pip install -r core/requirements.txt
To make sure everything is working in your virtual environment, run hello_world.py locally:
python core/flyte_basics/hello_world.py
Expected output:
Running my_wf() hello world
Now we are ready!
Demo Project
First, we will need to set up the Flyte demo cluster.
flytectl demo start
Then, we can test out the workflow locally.
pyflyte run core/flyte_basics/hello_world.py:my_wf
And to push it to the cluster.
pyflyte run --remote core/flyte_basics/hello_world.py:my_wf
You should see something like this:
Go to http://localhost:30080/console/projects/flytesnacks/domains/development/executions/f82bd12acd76d4505a04 to see execution in the console.
We have the console. Now let’s do a practice run.
pyflyte run --remote core/flyte_basics/basic_workflow.py:my_wf --a 5 --b hello
And you can see the successful project runs in the console as shown.
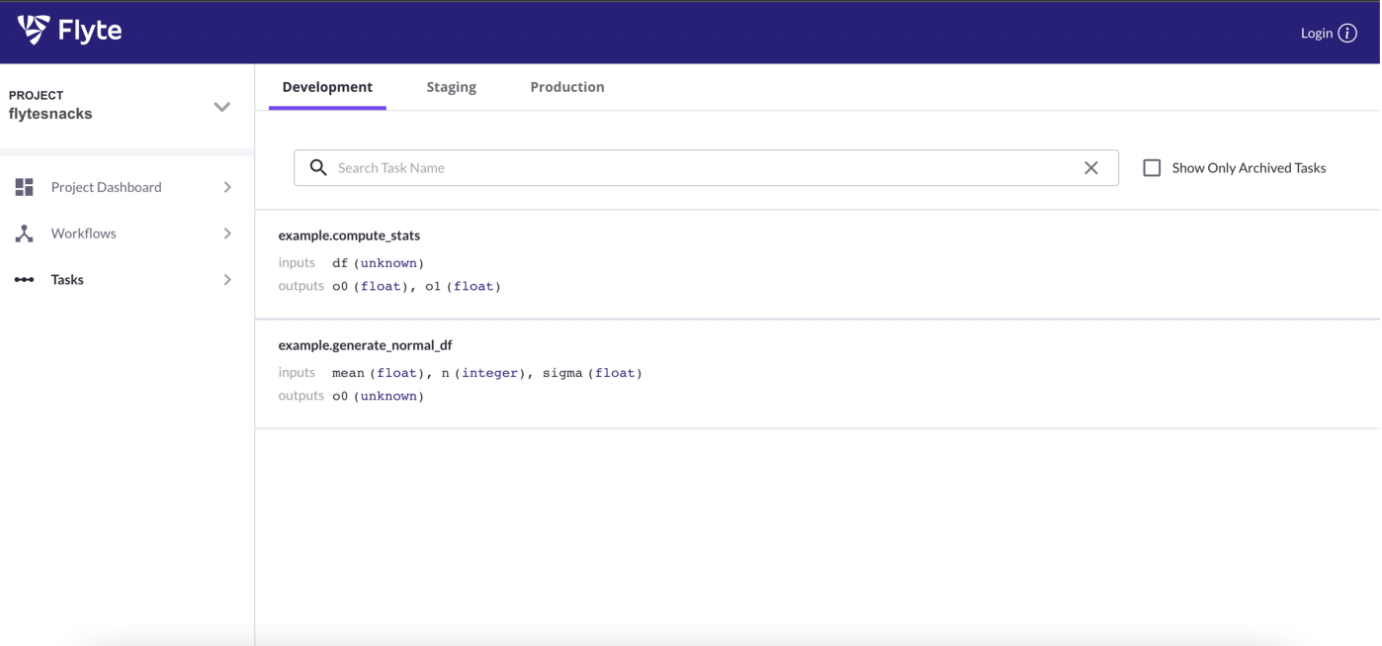
Do you see what I see? It is segmented out by development, staging, and production. Have you ever tried that with airflow? That is right. It did not work, hahaha.
You can change the domain from development to staging like this:
pyflyte run -d staging --remote core/flyte_basics/basic_workflow.py:my_wf --a 5 --b hello
Isn’t that awesome?
Pipeline
Next up, I created a pipeline to clean this table, and thus I set up a workflow that has an adjustable dataset parameter.
pyflyte run --remote datapipeline.py file_wf --dataset https://raw.githubusercontent.com/username/flyte/master/salary.csv
that starts the following workflow to analyze the data file from GitHub.
@workflow
def file_wf(
   dataset: str
    = DATASET_REMOTE
) -> pd.DataFrame:
   df = download_file(dataset=dataset)
   df = filter_columns(df=df)
   df = clean_data(df=df)
   df = filter_states(df=df)
   df = apply_types(df=df)
   return df
Each of the lines correspond to a task in a workflow.
The very first task is to download the file to read.
@task
def download_file(
       dataset: str
) -> pd.DataFrame:
    urllib.request.urlretrieve(dataset, DATASET_LOCAL)
    df = pd.read_csv(DATASET_LOCAL)
    return df
Now, you don’t actually have to download it “locally” or in the pod as I was running these jobs. You could use FlyteFile or FlyteDirectory instead.
Second task: I wanted to only look at a few columns, which you could standardize by adding a list of columns.
@task
def filter_columns(
      df: pd.DataFrame) -> pd.DataFrame:
    return df[['area_title','occ_title', 'tot_emp',  'jobs_1000', 'a_mean', 'a_pct10', 'a_pct25',
       'a_median', 'a_pct75', 'a_pct90', 'year','o_group']]
Third task: I needed to clean them by removing null values, drop duplicates, and removing rows with * and # symbols.
@task
def clean_data(df: pd.DataFrame) -> pd.DataFrame:
    df = df.dropna()
    df = df.drop_duplicates()
    df = df[(df != '**').all(1)]
    df = df[(df != '*').all(1)]
    df = df[(df != '#').all(1)]
    return df
Fourth task: I filtered states to only Washington, Oregon, California, Pennsylvania, Texas, Georgia, Florida, and Michigan.
@task
def filter_states(df: pd.DataFrame) -> pd.DataFrame:
    df = df[df['area_title'].str.contains("WA|OR|CA|PA|TX|GA|FL|MI|")]
    df = df[df['area_title'].str.contains("-")]
    return df
Fifth task: I wanted to enforce data types.
@task
def apply_types(df: pd.DataFrame) -> pd.DataFrame:
    return df.astype({"area_title": 'object',
                              "occ_title": 'object',
                              "tot_emp":'float',
                              "jobs_1000":float,
                              "a_mean":float,
                              "a_pct10":float,
                              "a_pct25":float,
                              "a_median":float,
                              "a_pct75":float,
                              "a_pct90":float,
                              "year":'object',
                              'o_group':str})
And this is what the UI looks like after failure and success:
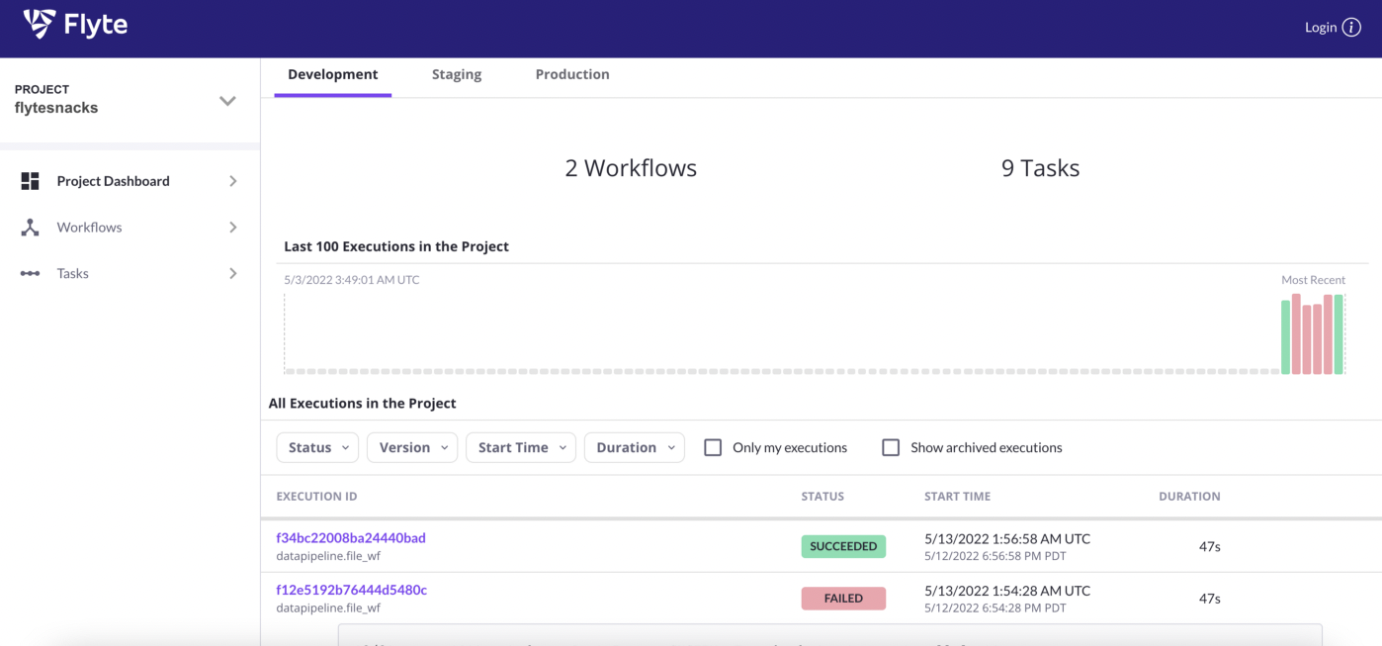
It will even show you which task actually failed or succeeded in this case.
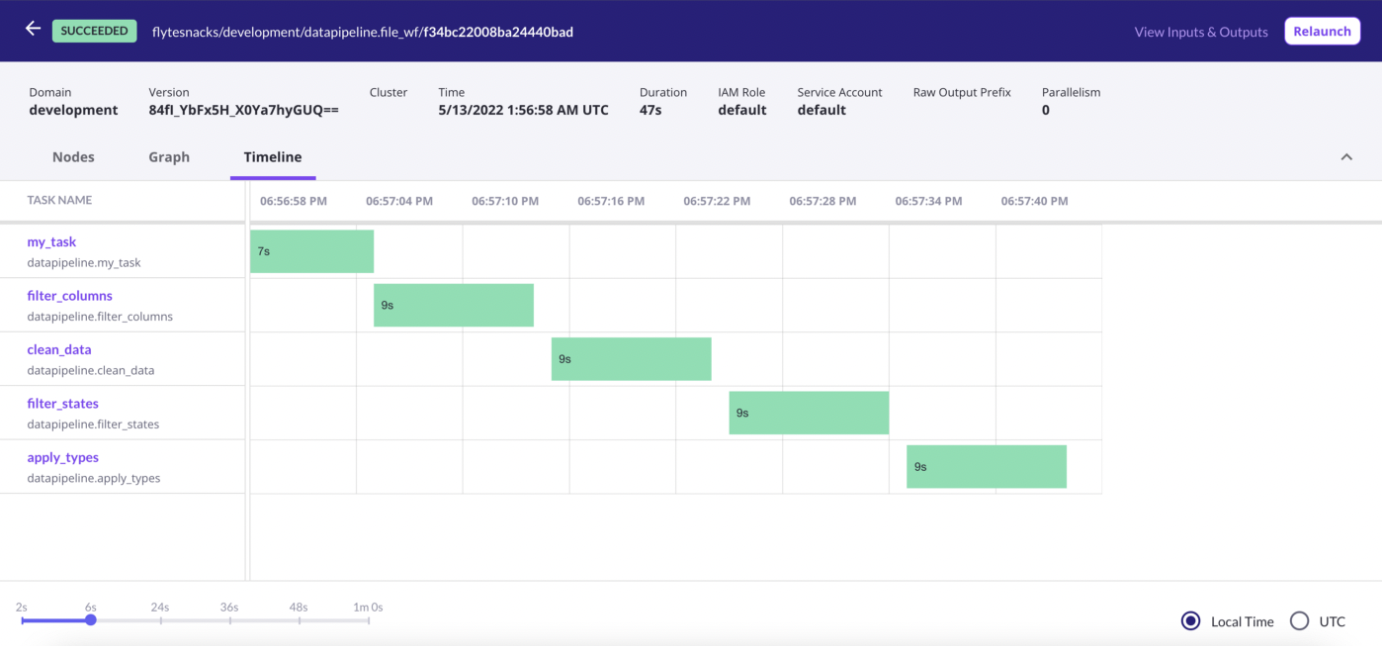
I have shown how to run Flyte locally and also on the Kubernetes demo cluster. I ran these tasks using different domains, “staging” vs “development,” and dynamically, where I can change the file path on the fly; both of these features are unique to Flyte.
Flyte has plenty more to offer, and I continue to play around with this awesome orchestrator, including its ability to handle machine learning algorithms and spark jobs.
